In the previous article (part 1 of 2), we explored how to get a single column CSV [comma-separated-values] file working with Kyma. We used this single stream of numbers to generate internal MIDI messages that controlled pitch, amplitude, timbre, location, and note duration. This article builds upon that knowledge, adding multi-column CSV/TSV [tab-separated-values] files as parameter arrays inside Kyma.
The following article will tackle four CSV/TSV data topics:
- Importing TSV files into the Sample Editor (data as waveform)
- TSV controls MIDI messages (MIDI Script)
- TSV controls EventValues (MIDI Script)
- TSV controls spectra (MIDI Script)
Quick terminology. CSV and TSV files structure data similarly, but each use a different delimiter (comma vs. tab) within the file. It is important to note that Kyma works extremely well with TSV files. If you use multi-column CSV files, you’ll either need to convert your file to TSV (I recommend csvkit), or specify Capytalk to ignore comma characters. (See Figure 7 and 8 below for difference in handling.) For purposes of this article, all example files will use TSV format.
Now’s a good time to download the example files. Of course, feel free to continue reading without the examples.
1. Importing TSV files in the Sample Editor (data as waveform)
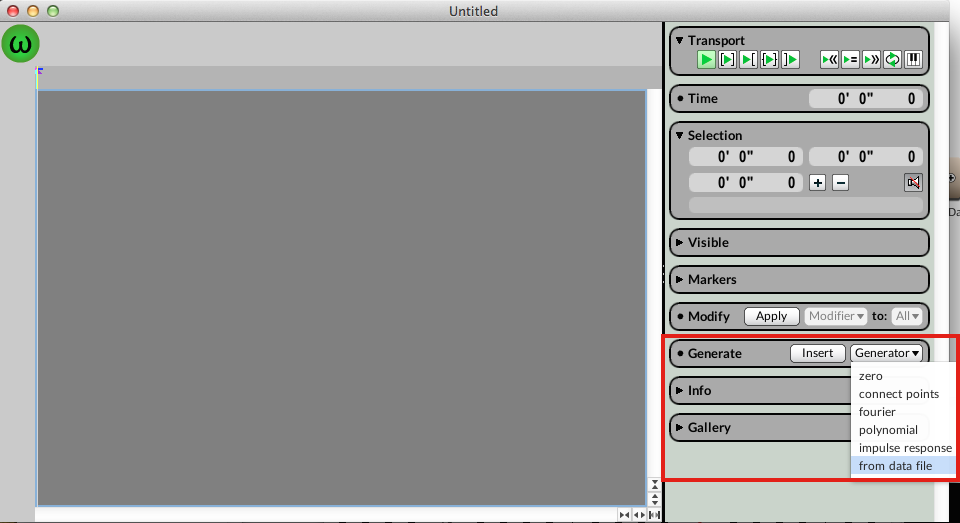
Figure 1. Kyma Sample Editor with Generate tab open
The Wave Editor in Kyma 7, (File > New > Sample file), allows you to generate audio from a variety of inputs (zero, connect points, fourier, polynomial, impulse response, and data file). Using the “from data file” selection in the Generate tab (Figure 1), we can import data from a TSV file, translating our TSV data into samples of amplitude data (e.g. an audio waveform).
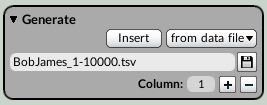
Figure 2. Generate Tab of Kyma Sample Editor.
The column number input (Figure 2) selects which column to import, and clicking on “Insert” translates this single column into amplitude data. In the included file, BobJames_1-10000.tsv there are two columns, and each column contains 5000 points of data. To understand how TSV data is translated into amplitude information (-1 to +1), this .tsv file contains actual amplitude data from an audio file. The first column of data contains the first 5000 samples, and the second column contains another 5000 samples of audio. Click “Insert” on column 1 and watch as how the audio waveform is recreated in front of our eyes.
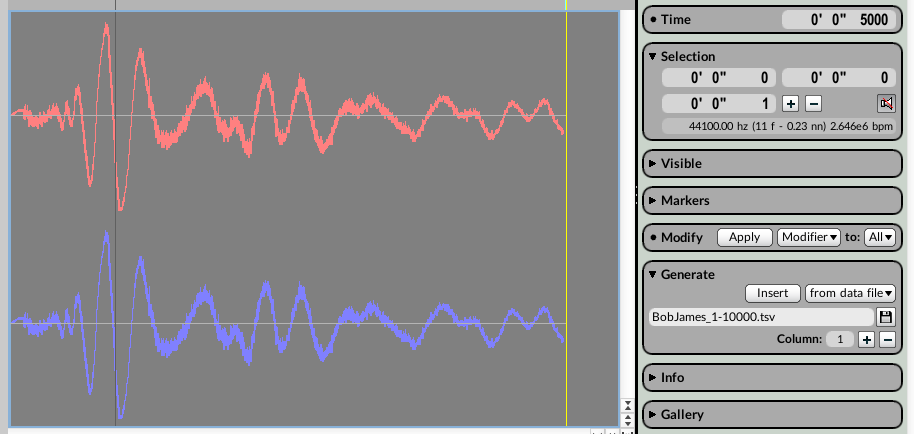
Figure 3. 5000 points of amplitude data imported in one click.
Listening back, we hear a kick drum.
No matter what range of numbers is in the TSV file, data is normalized to between -1 and +1 in the Sample Editor. Because one data point is translated into one sample of audio, lots of data points are required to return longer audio files. Treating data files as short wavetables may be best (4096 samples anyone?)
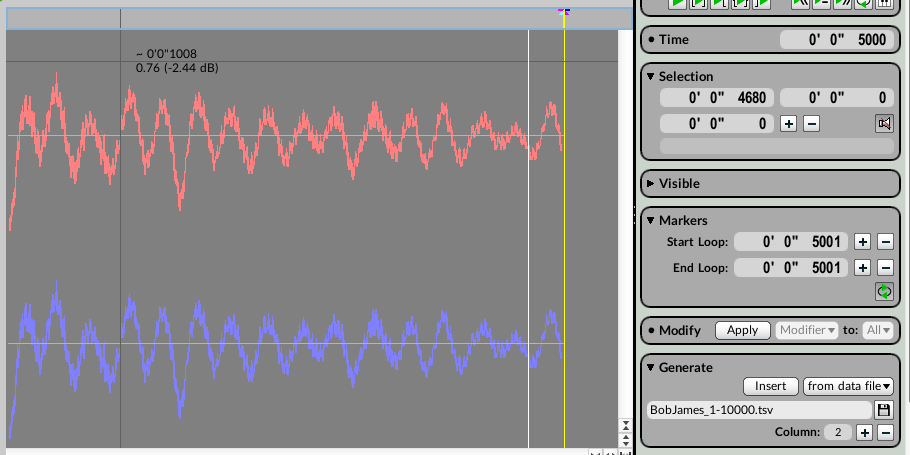
Figure 4. Importing column 2 of data file with 5000 points of amplitude data.
Column 2 contains another 5000 values. Below is Figure 4 playback, with loop on.
Other non-audio data can also be imported. The next two examples use Palmer Drought Severity Index (PDSI) data for grids within California over the last 2000 years (example file: grid_74_73_61_60_59_48_47_46_36_35.tsv). Each line, or row of data, contains ten columns, each accounting for a different location in California. One row represents a single year. Thus, as we import different columns of data, we are rendering audio for different locations around the state. With a single click, we can hear how the PDSI index for different locations in California change, especially listening with loop on. Looped continuously, each file generates a nice, sonic texture. PDSI grids 61 and 36 (TSV columns 3 and 9) are included below.
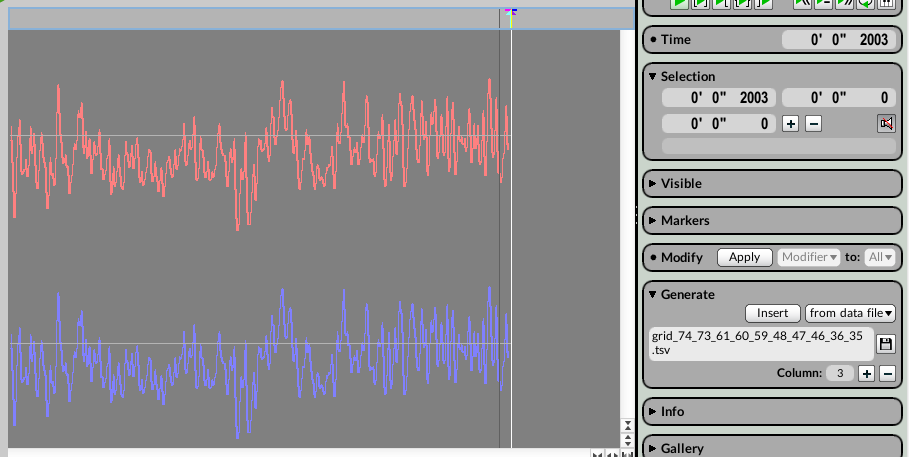
Figure 5. Palmer Drought Severity Index (PDSI) data from Grid 61 (near San Diego, CA)
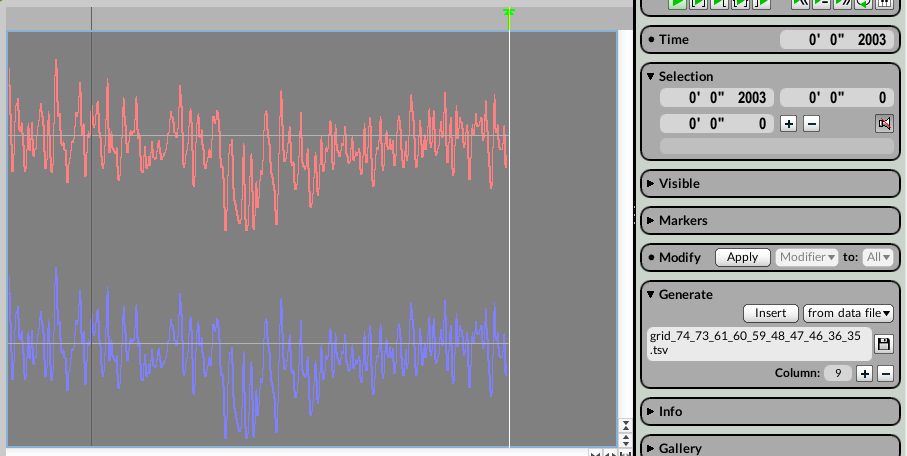
Figure 6. Palmer Drought Severity Index (PDSI) Grid 36 (near San Francisco, CA)
2. TSV controls MIDI messages
Sections 2-4 describe how TSV data control different sound parameters (MIDI message, EventValues, spectra tracks) within Kyma. Kyma’s MIDI Script Sound is one way to translate our data arrays into time-varying sound event controls.
Building from the first article, we store our data row as a variable, converting our entire TSV data row into an array (instead of one-column, single value variables). The conversion from multi-column string to single data array variable takes two steps. First, we open the file and create a TextFileStream on that file by sending it the message: textFileStream.
f := 'SanFran1990-2015_rows2-5.tsv' asFilename textFileStream.
Once we have a TextFileStream we can request an array of parameters by sending it the Smalltalk message nextParameters, as shown below.
lineValArray := f nextParameters.
nextParameters creates reads an entire line from the data file and stores it in an Array. Since commas are considered elements within nextParameters, be sure to only use TSV files.
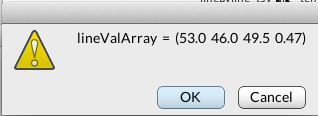
Figure 7. First line of four-column TSV file saved as data array.
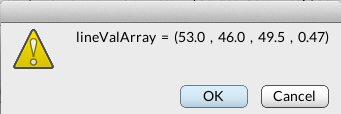
Figure 8. First line of four-column CSV file saved as data array. Notice how commas are treated as values within the array.
The rest of the code in the example Sound uses our array of values to construct a MIDI message. Instead of working with one variable, however, there are multiple data points that we can utilize within each MIDI message. To access a data point, use the syntax <ArrayName> at: <Index>. For example,
register := ((lineValArray at: 2) roundTo: 12).
This will read the value from the second entry of the Array stored in lineValArray; next it will round that value to the nearest multiple of 12, and store the rounded value in a variable called register. This corresponds to taking the value from the 2nd column of the TSV file and rounding it to the closest multiple of 12. In the example, we use this value for octave transposition within our MIDI key event message. Open up the example Sound TSV_file temperature data as MIDI message to see how the TSV values were used in the script. I’ve included audio of a mapping of the TSV data set, San Francisco Weather Data 1990-2015, that utilizes this script below.
3. TSV controls EventValues
A MIDIVoice Script can control any free EventValue in its input Sounds. In the example Sound, TSV_file controls EventValues, the Script parameter uses two values (TSV columns 1 and 2) to control EventValues !Reverb and !Pan separately. EventValues !Reverb and !Pan are HotValues in the Eugenio Reverb Sound that is the Input to the MIDIVoice. Here is how a data value is used to control the EventValue !Pan.
params := f nextParameters.

pan := ((params at: 1) into: #({-2.341@0} {1.758@1}) ) abs.

self controller: !Pan slideTo: pan byTime: (line * 100) ms.
Like before, nextParameters converts the TSV line into an array (params). The next line normalizes the data (TSV column 1) to between 0 and 1. (Note: I used the first column of data’s maximum and minimum (-2.341 and 1.758) to achieve this linear mapping). The data is stored into a variable (pan). The last line of code sets the EventValue !Pan to the value in our variable, pan, smoothly interpolating over the course of 100 ms. Each line of data (stored in the variable, line) advances the timing. Consecutive data points are interpolated by Kyma. Listening back, we hear how the Reverb and Pan are independently controlled by the data.
In the VCS window, we notice that !Reverb and !Pan are absent from view. (Figure 9) This is because the MIDIVoice Script binds those EventValues to concrete values so they are no longer “free” to be controlled from the VCS.
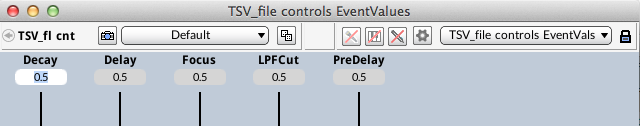
Figure 9. Controlling EventValues with MIDI Script removes them from the VCS.
One way to view the bound EventValues in the VCS is to place the EventValue we are controlling (e.g. !Pan) in the Value field of a SoundToGlobalController. The SoundToGlobalController generatedEvent parameter could be something like !PanMonitor. That would cause !PanMonitor to display the data-driven changes to !Pan in the VCS.
4. TSV controls Spectra
This last example is a bit more complex. A TSV file controls an array of spectra over time. The mapping seems pretty straight-forward, one array controls another array, but during my initial research, I got a little over my head in Smalltalk. (A big thank you to Carla and Kurt for helping out.) In the example Sound, TSV_PDSI_CA controls spectra amplitude, navigate to the SpectrumModifier Sound. The AmpScale parameter field contains the expression:
TrackNumber of: {!Fader copies: 20}
What this means is that the amplitudes of the first 20 spectral tracks will be controlled by 20 EventValues named !Fader0, !Fader1, .. !Fader19.
In our Script, for each time point, we loop through our params array (which contains only 10 points of data) and set the value for each !Fader. Our ten TSV values are used twice, once for spectra !Fader 0-9 and a second loop for spectra !Fader 10-19.
1 to: params size do: [ :i |
self controller: (i - 1 of: {!Fader copies: 20}) slideTo: ((params at: i) into: #({-3.617@0} {0@0.1} {2.186@1}) ) abs byTime: (line * 100) ms.
 "each line is 100 ms"

"reloop and use params for next 10 Faders too"

self controller: (i + 9 of: {!Fader copies: 20}) slideTo: ((params at: i) into: #({-3.617@0} {0@0.1} {2.186@1}) ) abs byTime: (line * 100) ms].
The Script controls only the first 20 spectra tracks of the OscillatorBank, even though more tracks are available. The TSV data is the Palmer Drought Severity Index (PDSI) for CA, and we are tying the data to spectral amplitudes of the sound of rain. Lower rainfall levels equate to quieter sound (lower spectral amplitudes), while the increased sound of rain equates to higher levels of rainfall.
Going a step further, the next example Sound, TSV_PDSI_CA controls spectra on/off and amplitude, not only controls the amplitudes of 40 spectral tracks, but also turns these tracks on/off depending on a threshold. As we can see inside the Script, I am reusing ten data points a bit much. However, now that one can control individual spectra with a Script, larger arrays of data points could easily be utilized within Kyma. (e.g. 128 columns of TSV data for 128 spectral tracks)
Conclusion
As the article outlines, TSV files are just a single click (or a line of code) away from integration with Kyma. Whether data is used algorithmically to control MIDI events, EventValues, or any other type of parameter inside Kyma, one can quickly listen to data in new and interesting ways. Feel free to populate this article’s example files with your own data, or try inserting your data directly into Kyma’s Wave editor (File > New > Sample File). Of course, please leave a Reply with a link to your own TSV data sounds! #csvkyma